Petch_A_Ratana/iStock via Getty Images
DISCLAIMER: This note is intended for US recipients only and, in particular, is not directed at, nor intended to be relied upon by any UK recipients. Any information or analysis in this note is not an offer to sell or the solicitation of an offer to buy any securities. Nothing in this note is intended to be investment advice and nor should it be relied upon to make investment decisions. Cestrian Capital Research, Inc., its employees, agents or affiliates, including the author of this note, or related persons, may have a position in any stocks, security, or financial instrument referenced in this note. Any opinions, analyses, or probabilities expressed in this note are those of the author as of the note’s date of publication and are subject to change without notice. Companies referenced in this note or their employees or affiliates may be customers of Cestrian Capital Research, Inc. Cestrian Capital Research, Inc. values both its independence and transparency and does not believe that this presents a material potential conflict of interest or impacts the content of its research or publications.
The Greatest Rug Pull Of All Time
In 2020 and much of 2021, crypto was easy money. Actually, it was two kinds of easy money. It was easy money if you traded it, and it was easy money if you were paid to promote it as something that everyone including your grandparents should trade.
And, like all easy money schemes, it came to an ignominious end.
From this:
Crypto Bros Buy Real Estate (NY Post)
To this:
Crypto Bankruptcies (The Tokenist)
The Wild West days of jumping aboard whichever coin was trending that week are likely done with as a reliable way of making money (don’t laugh – for many it was a reliable way of making money for a time).
All Risk Assets Have Sold Off In 2022
From the 2021 peak, even the two leading crypto names have experienced a deep selloff. Think your S&P-heavy 401k is hurting? Your high-beta tech portfolio causing you pain and worry? Imagine if you had bought the crypto dream and held in anticipation of the Moon, the Lambo, or whatnot.
Here’s the S&P 500, the Nasdaq-100, the BTC-USD cross, the ETH-USD cross, and the ARK Innovation ETF (ARKK) over the last 12 months, shown as the percent drop from the high of that period.
% Off Highs Chart (YCharts.com)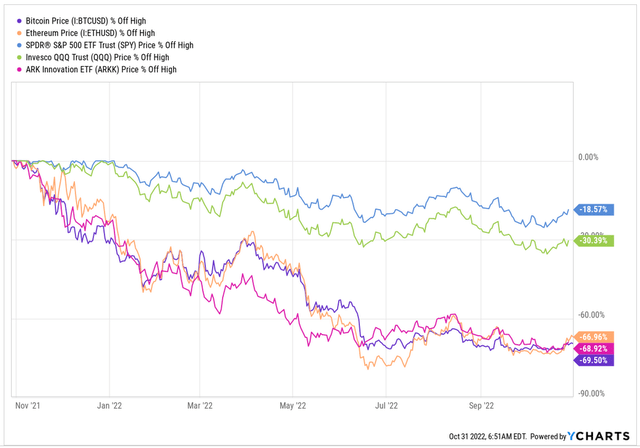
S&P painful, Nasdaq more so; crypto and ARKK all clustered together with a 2/3 drop in value. Ouch.
This has led, of course, to a certain fear level in crypto.
Crypto Fear vs. Greed Index (Alternative.me)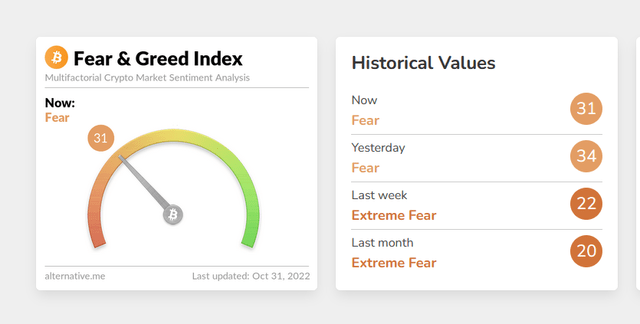
Now, a theme of our work is that in securities markets it’s always Opposite Day. So if something is all beaten up and FinTwit has decided it is dead and buried forever, our interest is piqued.
We Anticipate Growing Strength In Certain Crypto Assets
Crypto, we believe, is going through a bifurcation and transformation. We believe that the two leading systems – Bitcoin and Ether – will pull away from the altcoin pack. We believe that the two systems will become professionalized and institutionalized. That they will become more like securities both in practice and, quite likely, in principle and, over time, in law. We expect all this to be to the chagrin of both the “let the code be free” mathmo types and the “Wen Lambo” crypto bro crowd. But it will be to the benefit of institutional investors and those who choose to invest in the manner of those institutions.
In our single-stock analysis, we utilize the notion of the “Wyckoff Cycle” which as you know is an idealized form of how large account players are able to create and realize gains solely from buying and selling activity itself, not from any underlying intrinsic value. We’ve written about this extensively elsewhere, including here.
We think that Wyckoff-type institutional accumulation already has begun in both Bitcoin and Ether.
We track both daily vs the main stock indices – initially we did so as a kind of canary-in-the-coalmine early indicator of risk appetite. Few instruments are as high-beta as crypto; Bitcoin and Ether are the most liquid crypto instruments; so, we thought, we can use them as advance warning of what may come each day or week in the S&P or the Nasdaq. And this isn’t a bad tool as it turns out. Not perfect, of course, but not bad.
Where this got really interesting though was after the June lows were struck in the equity indices. As you know, there was a violent rally to the August highs and an equally violent drop to the October lows which were below the June lows in the S&P, in the Nasdaq and the Dow, and a double-test of the same lows in the case of the Russell. And crypto being high beta – meaning it overreacts to changes vs. the S&P say – you would expect a similar pattern plus some amplification. Right?
Wrong. Look. Here’s the S&P – the Nasdaq and the Dow follow suit, by the way.
SPY June vs October 2022 lows (TrendSpider, Cestrian Analysis)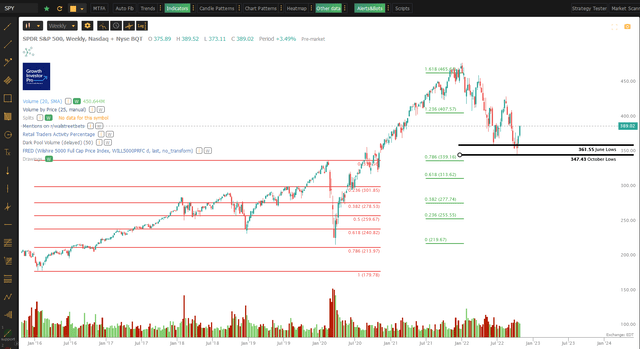
Now, look at BTC.
BTC June Lows (TradingView, Cestrian Analysis)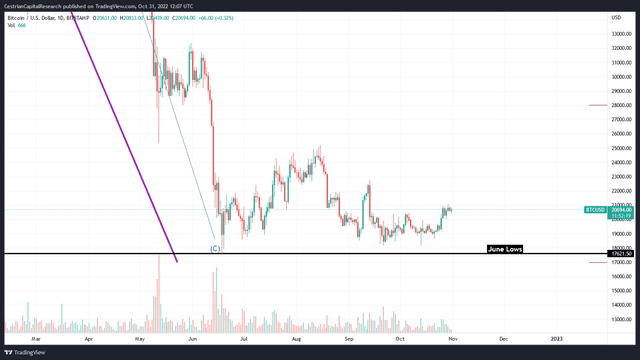
And at ETH.
ETH June Lows (TradingView, Cestrian Analysis)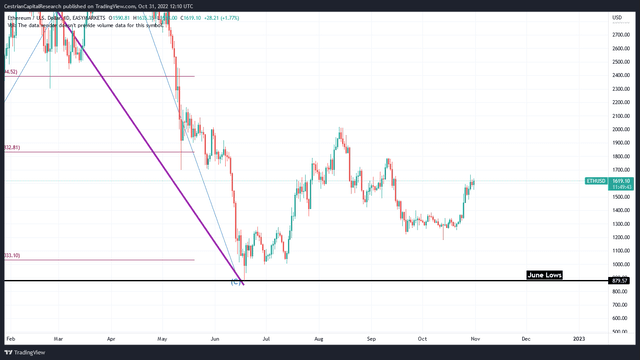
So on the face of it this already looks interesting. Why would two very-scary-indeed assets hold up over the June lows when the major stock market indices did not?
Well, there are two reasons, in our view, not mutually exclusive.
First, derivatives. The indices and their ETFs are subject to substantial pressures from the huge wall of capital sloshing around in the options market. Indeed, if you take a look at major reversals of the S&P through an options market lens, you can see the power of options flows – the reversals tend to happen upon large-volume options expiry dates, after which market makers rebalance their hedges to get back to a delta-neutral position. Again, here’s the S&P. (Underlying analysis includes work by SpotGamma.)
S&P – Options Expiry Impact (SpotGamma, Cestrian Analysis, TrendSpider)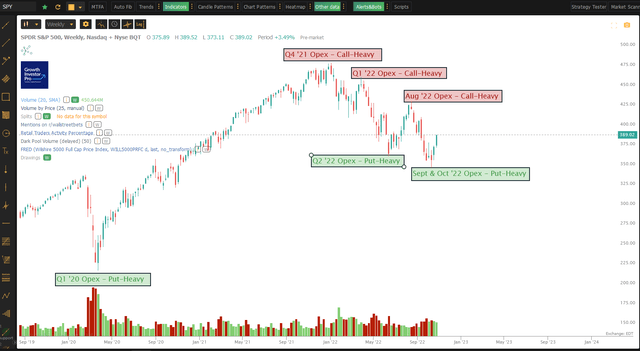
Crypto doesn’t have anything like this level of pressure from the derivatives market. So we don’t think the strength of crypto can be explained away through options expiries – you can however make a good case that the weakness of equity indices in September and October is due to the impact of a wall of puts being bought by investors.
No, our second reason is that we believe that Bitcoin and Ether are now being quietly accumulated by institutional investors. We think that the price and volume activity supports this thesis.
Let’s look at Ether first, because the evidence there is more compelling than Bitcoin, in our view.
ETHUSD – Volume By Price Analysis (TradingView, Cestrian Analysis)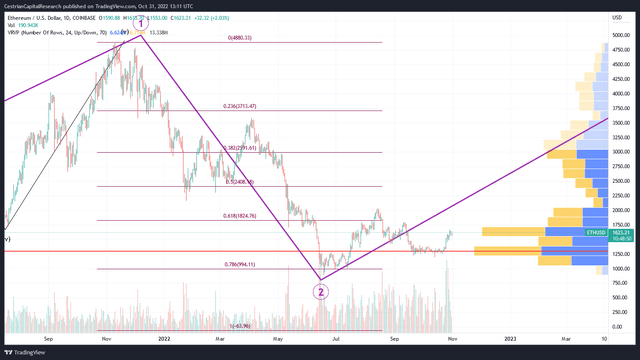
The blue/yellow bars on the right-hand side of the chart show volume traded at each price level. The chart starts in July 2021 and the volume by price indicators do likewise. The largest volumes of purchases have been made in the range of roughly $1050-$1725.
Zooming out, you can see that this price zone corresponds broadly to typical ‘Wave 2’ (shock and awe selloff!) retracement levels.
ETHUSD Fibonacci Retracement Analysis (TradingView, Cestrian Analysis)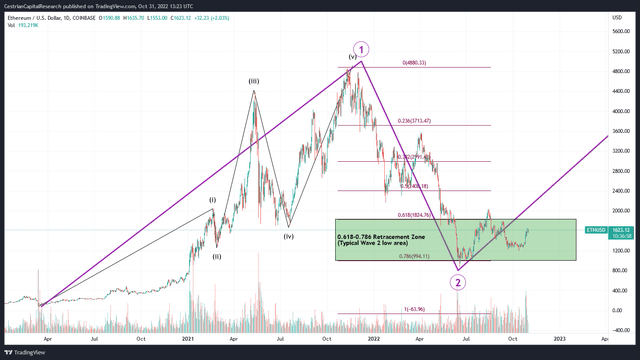
And that in our view is no coincidence. The reason you see support for shock & awe selloffs around this level and speed of deep retracement – a Wave 2 in Elliott Wave parlance – is that this level of dumping drives the despair that you see in retail crypto right now (or retail e-commerce, etc., for that matter). Institutions, not being prone to despair, have long known to buy the fear, embrace the abandonment. And this we believe is taking place in Ether right now.
If you zoom back in you can start to see a larger-degree Wave 3 (which could reach at least a new high above $4880 if we have the pattern correct) take shape with an i, ii, and iii up off of those June lows. Like this:
ETHUSD Smaller Degree Wave Pattern (TradingView, Cestrian Analysis)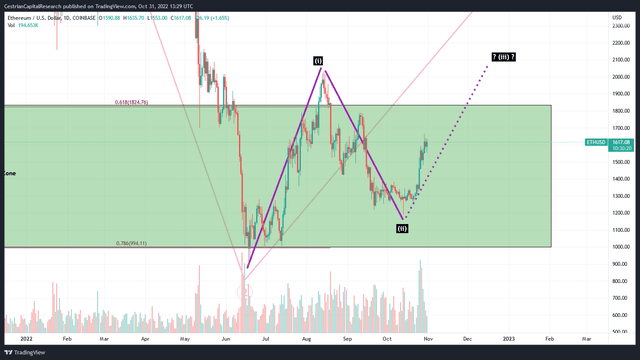
We’re bullish on Ether in consequence. Should ETH-USD reach up and over $2,035 anytime soon that would be further confirmation of our bull thesis.
Turning now to Bitcoin which has a less compelling chart in our opinion, but still has the signs of accumulation in its volume by price action which again has hit heavy volumes at the same Wave 2 retracement zone down from the Wave 1 struck from the 2020 lows to the 2021 highs.
BTCUSD Volume x Price at the 786 Retrace (TradingView, Cestrian Analysis)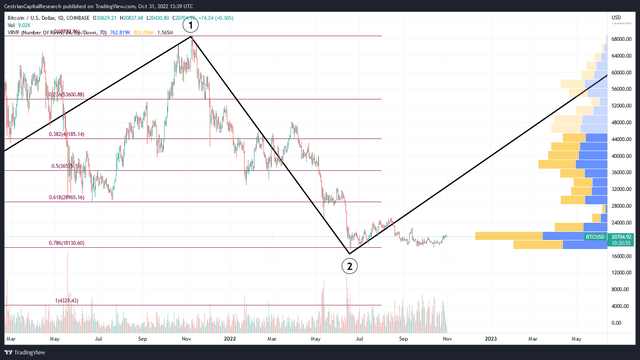
Why less compelling than Ether? Because we don’t yet see the characteristic 1 up, 2 down, 3 up pattern of a new bull phase taking shape. But you can see the accumulation for yourself.
We’re bullish on Bitcoin – just not as bullish as for Ether.
Cestrian Capital Research, Inc – 31 October 2022.
JOIN THE #1 TRENDING SUBSCRIPTION SERVICE ON SEEKING ALPHA!
Our premium Growth Investor Pro service continues to grow in popularity and critical acclaim. It is one of the most successful, fastest-growing and best-reviewed services on Seeking Alpha in 2022. We cover growth stocks, value stocks, commodities, ETFs, market indices, the whole nine yards. Real-time updates and alerts, three webinars per week, long ideas, short ideas, hedging strategies, you name it. You can learn all about it here – pricing is from $125/month. Join us today!