Ethereum ETH/USD was leading the crypto sector during Friday’s 24-hour trading session, rising more than 5%, in tandem with the general market, which saw the S&P 500 surging about 2% higher.
Bitcoin BTC/USD was lagging slightly, edging about 2% lower, while Dogecoin DOGE/USD was the most muted of the three, edging higher by about 1%.
The stock market jumped on Friday after Apple printed a second-quarter earnings beat, despite warnings the stock market could crash and the U.S. could be thrown into a recession amid the debt ceiling crisis. Nonfarm payrolls, the unemployment rate and wage growth data released on Friday morning indicated the economy is not surrendering to the Federal Reserve.
On Friday the stock market appeared immune to the economic risks and was spiking higher, and the crypto sector appeared to be moving in tandem with the stock market as opposed to spot gold, which was retracing toward the psychologically important $2,000 mark.
Here’s what to watch on Bitcoin, Ethereum and Dogecoin over the weekend:
Want direct analysis? Find me in the BZ Pro lounge! Click here for a free trial.
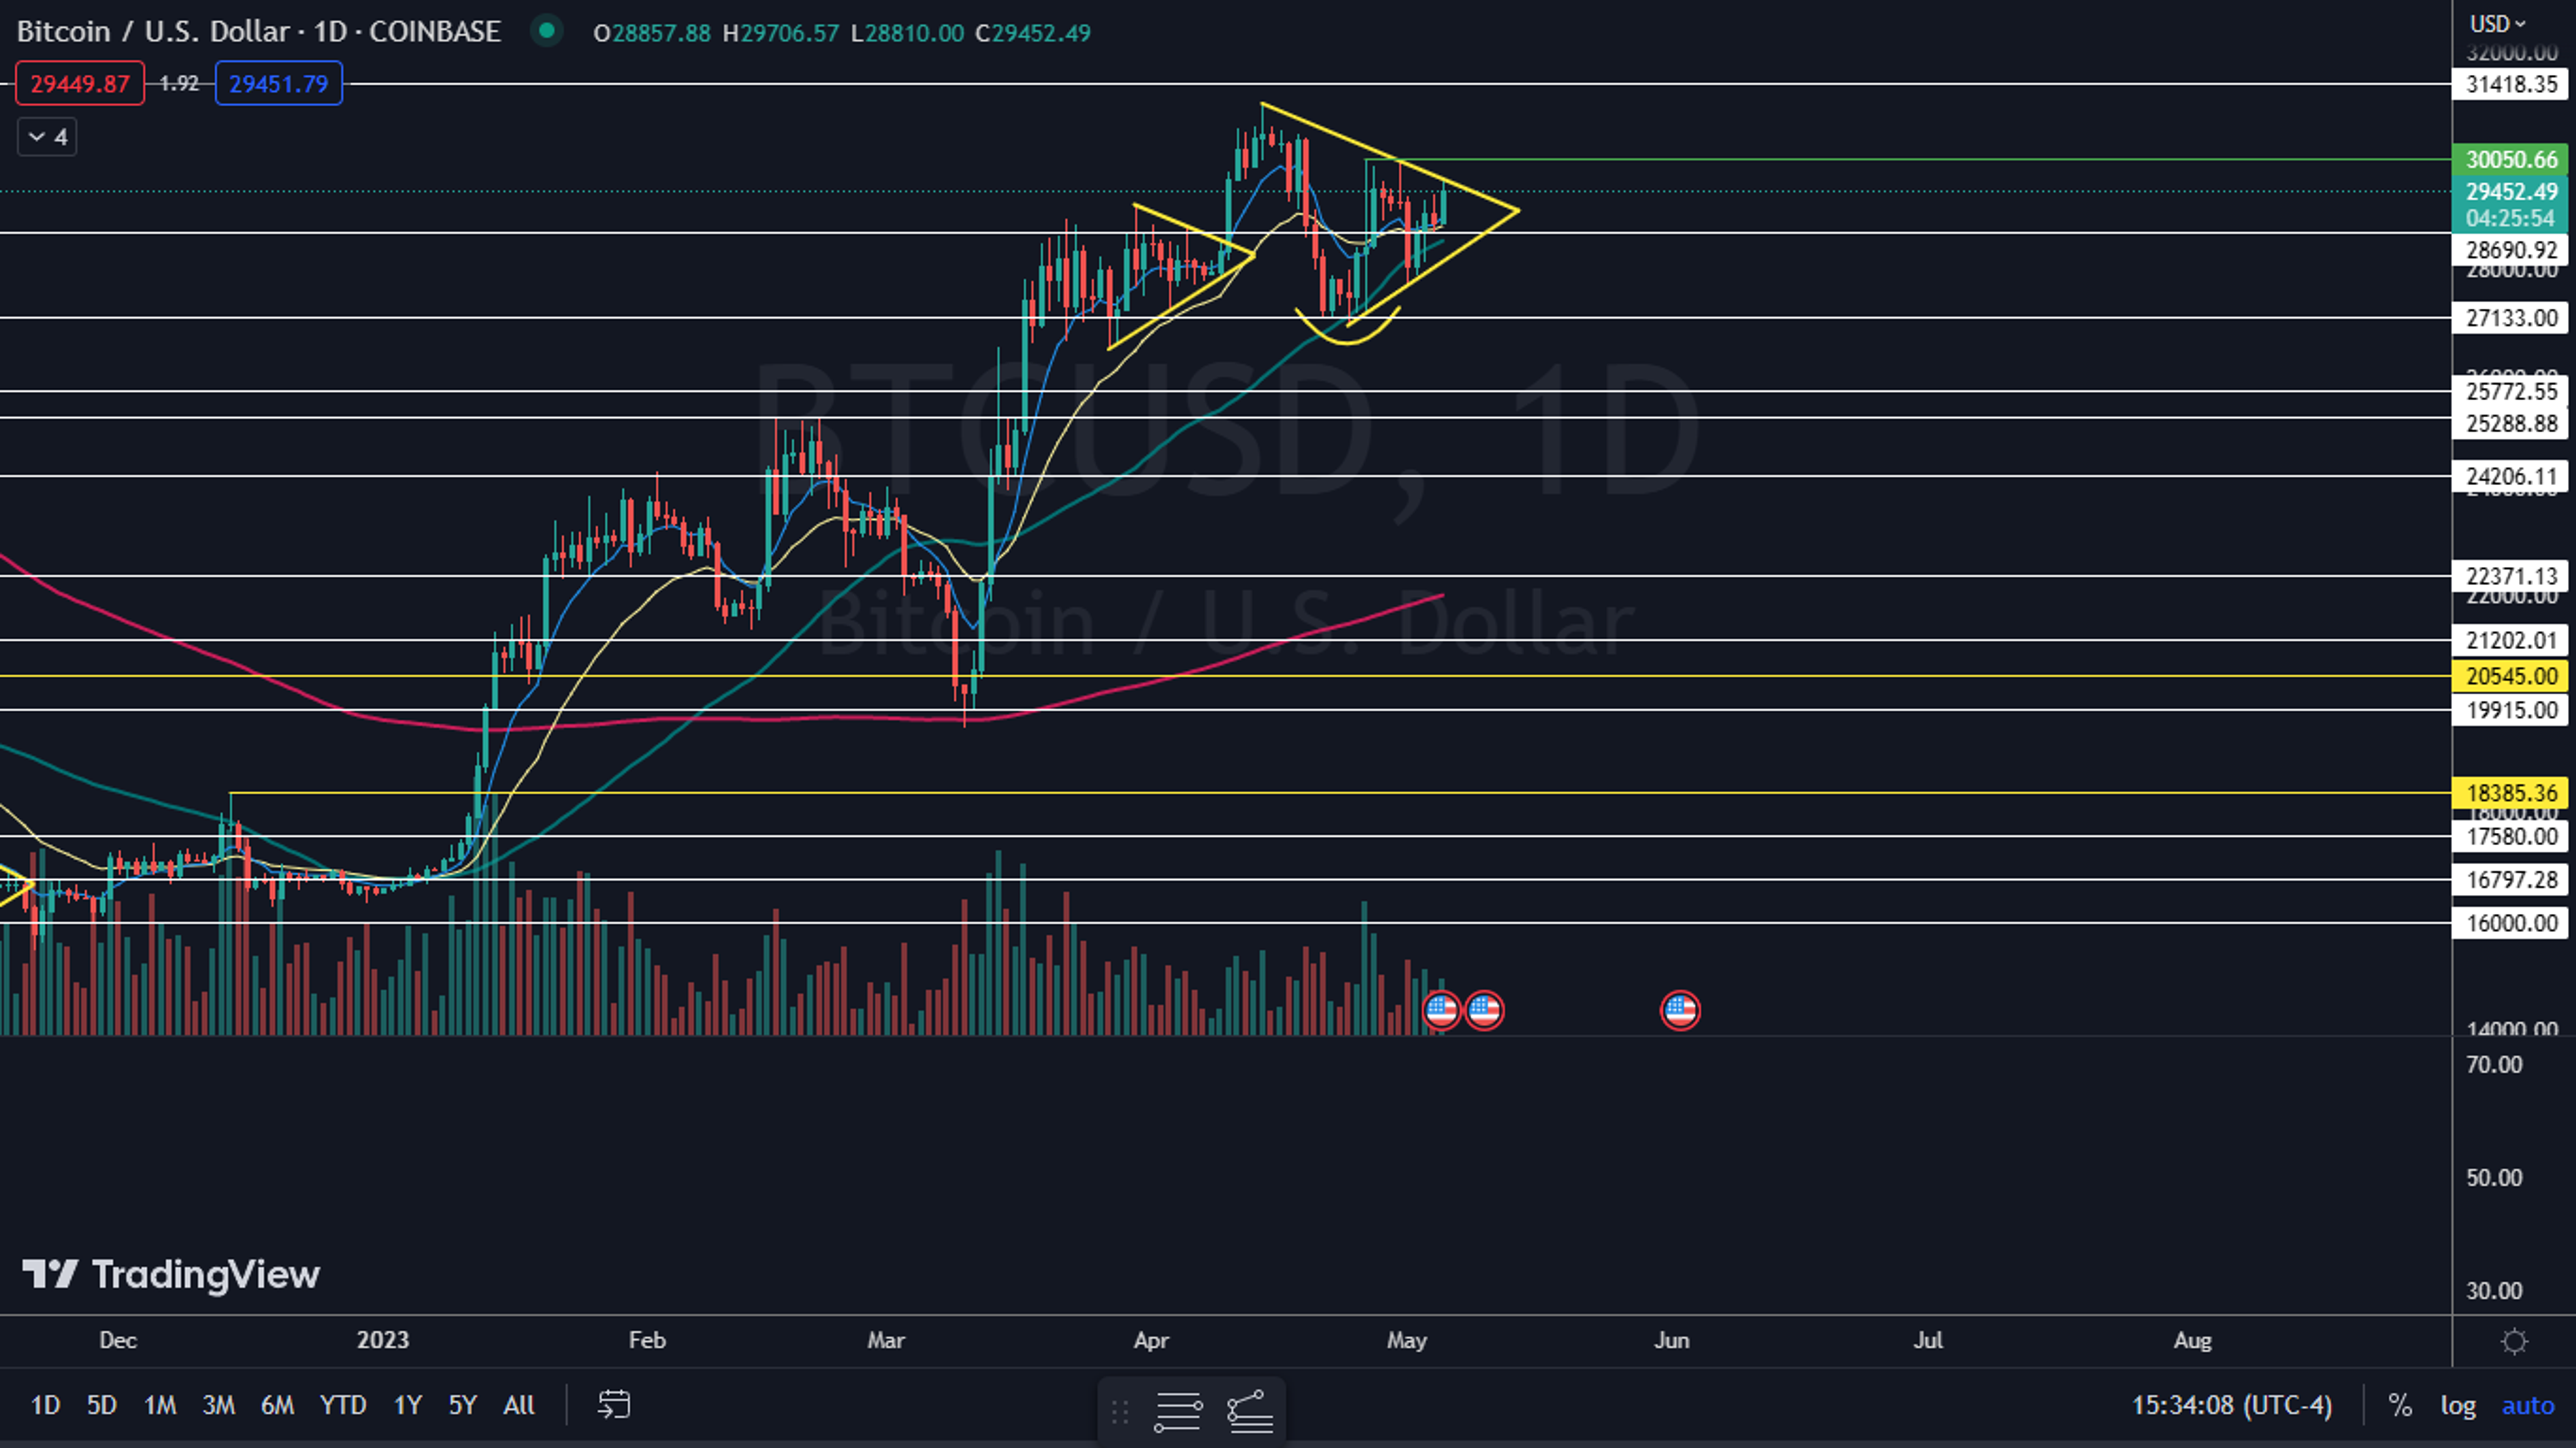
The Bitcoin Chart: Bitcoin has been making a series of lower highs and higher lows, which has settled the crypto into a triangle pattern on the daily chart. The crypto is set to meet the apex of the triangle on May 14 and traders can watch for Bitcoin to eventually break up or down from the pattern on higher-than-average volume to indicate a future direction, although the pattern leans bullish.
The 50-day simple moving average has been acting as support and guiding Bitcoin higher since March 13. Over the last five days, Bitcoin has dropped to test the area as support and bounce. This suggests that if Bitcoin falls under the 50-day, it could be a good place to stop out a bullish trade.
Bitcoin has resistance above at $30,050 and $31.418 and support below at $28,690 and $27,133.
The Ethereum Chart: When Ethereum burst higher during Friday’s 24-hour trading session, it formed a higher high to confirm a new uptrend. The most recent higher low was formed on May 1 at $1,805 and on Friday, Ethereum traded above the lower high of $1,939.
If Ethereum closes the trading session near its high-of-day price, the crypto will print a bullish Marubozu candlestick, which could indicate higher prices will come again on Saturday. The second most likely scneario is that the crypto will trade sideways to form an inside bar to consolidate.
Ethereum has resistance above at $2,150 and $2,317 and support below at $1,957 and $1,846.

The Dogecoin Chart: Dogecoin has been trading mostly sideways under the 200-day simple moving average since April 22, showing no clear trend. The move has come on lower-than-average volume, which indicates a current lack of interest in the crypto.
Bullish traders want to see big bullish volume come in and break Dogecoin up above the 200-day SMA, which could indicate a bull cycle is on the horizon. Bearish traders want to see big bearish volume come in and throw Dogecoin into a confirmed downtrend.
Dogecoin has resistance above at $0.083 and $0.091 and support below at $0.075 and at 7 cents.

Read More: Gold-Backed Tokens To The Rescue: Can They Save Zimbabwe’s Currency Crisis?
Photo: Shutterstock
© 2023 Benzinga.com. Benzinga does not provide investment advice. All rights reserved.


