On-chain data shows the percentage of Bitcoin volume occupied by the exchanges has shot up to all-time high levels. Here’s what it could mean.
Bitcoin Exchange Volume Dominance Has Increased To 76.4%
According to data from the on-chain analytics firm Glassnode, the exchange volume dominance has been at high levels recently. The “exchange volume dominance” refers to the percentage of the total Bitcoin on-chain volume flowing in and out of all centralized exchanges.
Generally, investors use these platforms whenever they want to participate in buying or selling activities. Thus, when the exchanges observe a high volume, it suggests that BTC users are actively interested in trading right now.
On the other hand, low values of the exchange volume dominance imply transactions between self-custodial entities are currently the dominant form of movement on the blockchain.
This could suggest that the investors prefer to trade through over-the-counter (OTC) means or some other application of the blockchain involving peer-to-peer (P2P) transactions is what the investors are engaged in.
There is also another possibility: the network as a whole is inactive, so while exchanges are seeing lesser dominance, the volumes outside aren’t exceptionally high, either.
Now, here is a chart that shows the trend in the Bitcoin exchange volume dominance over the history of the cryptocurrency:
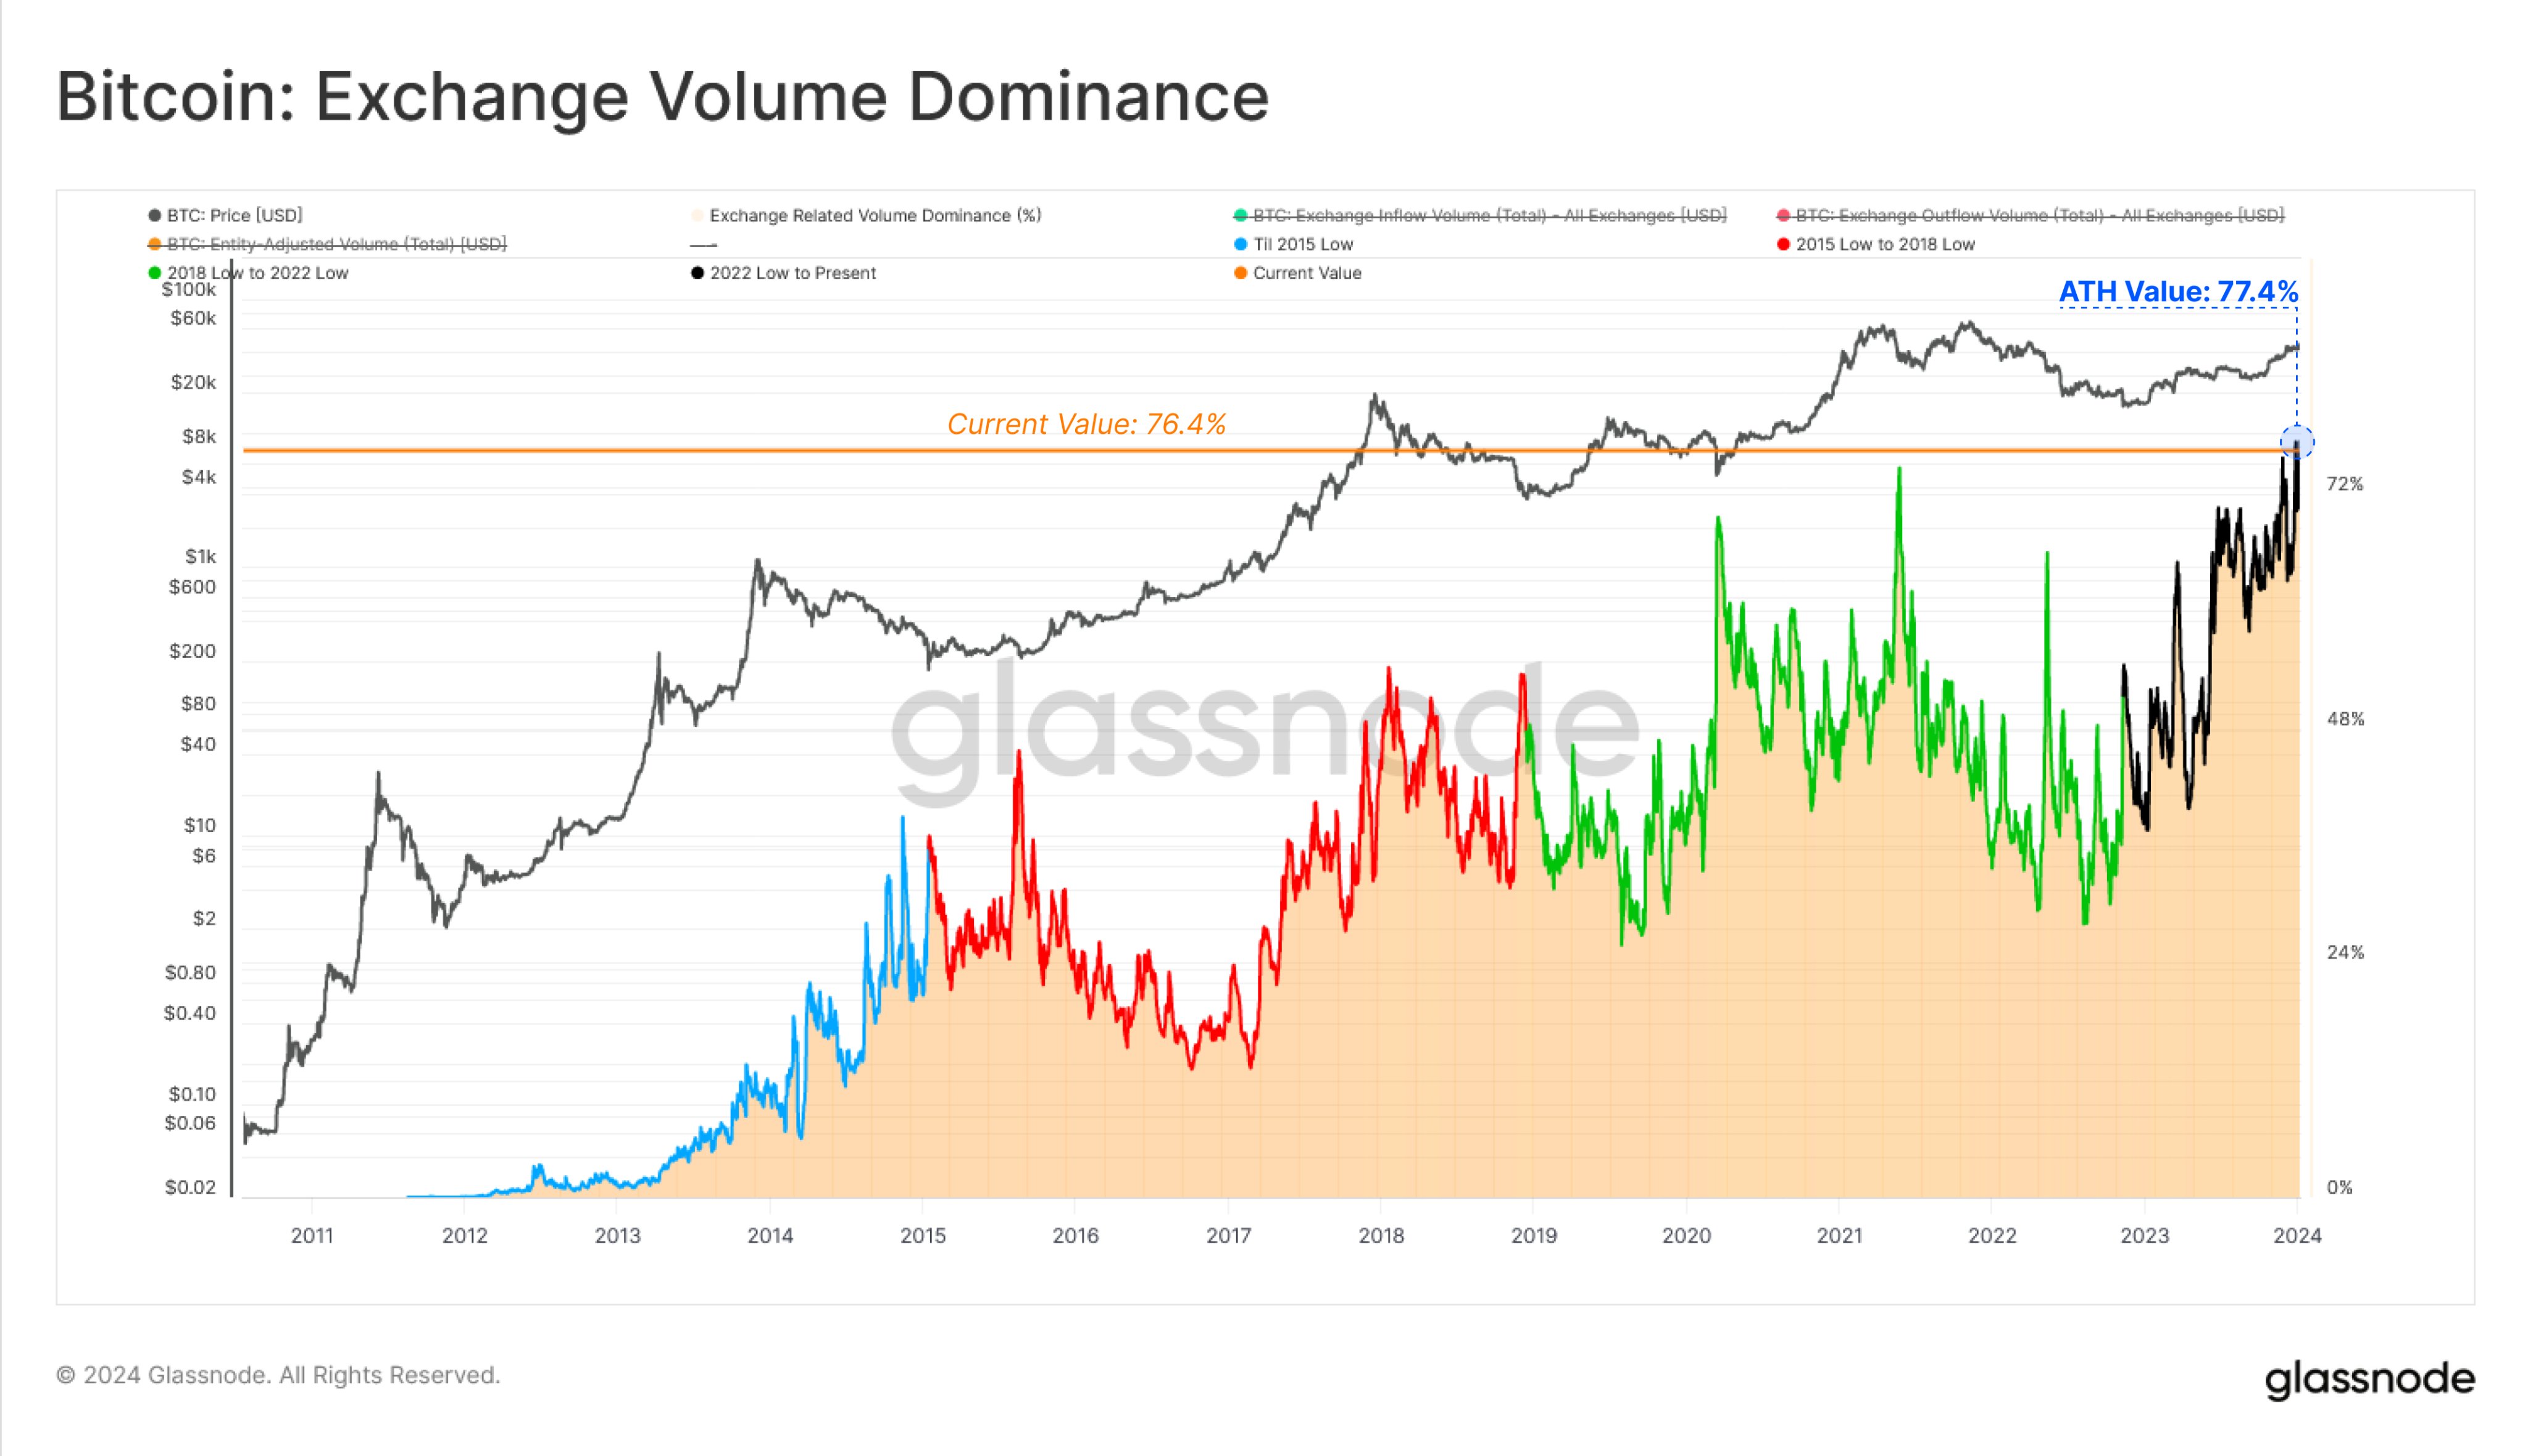
The value of the metric seems to have been going up in recent days | Source: Glassnode on X
As displayed in the above graph, the Bitcoin exchange volume dominance had been relatively high during the second half of 2023, but the indicator has spiked especially high recently.
During the peak of this latest surge, the indicator managed to set a new all-time high (ATH) of 77.4%. Currently, the metric is floating at slightly lower levels of 76.4%.
The chart shows that the exchange volume dominance has historically observed large spikes alongside selloffs in the asset. These spikes have usually been events that diverged far from the norm, though, while the recent spike has only taken the indicator to levels not too higher than the preceding trend.
This latest interest in moving coins into and out of exchanges has come as the BTC ETF deadline is just around the corner, which many expect to end in approval from the US SEC.
During the past day, there has also been a fake ETF announcement on SEC’s own X handle, resulting in the account becoming compromised. The news also triggered quite a reaction from the market, so, unsurprisingly, the exchanges have been busy processing withdrawals and deposits.
Once the ETF decision is passed, the traders will likely again make a significant number of moves, thus further propping the exchange volume dominance at these high levels.
BTC Price
Following its decline during the last 24 hours, Bitcoin is down to about $45,100. The below chart shows the volatility the asset has gone through during this period.
Looks like the price of the coin is on its way to erase its recent gains | Source: BTCUSD on TradingView
Featured image from Kanchanara on Unsplash.com, charts from TradingView.com, Glassnode.com


