
A widely followed crypto analyst is issuing a warning to traders saying that Bitcoin’s (BTC) downtrend is not over after displaying a bearish signal.
Crypto trader Ali Martinez tells his 30,900 followers on the social media platform X that the king crypto appears to be forming a classic bearish flag pattern.
Bearish flag patterns are used in technical analysis to forecast abrupt moves to the downside. They are formed when price consolidates upwards after a strong downtrend, but fails to break a key support level.
“Bitcoin seems to be shaping a bear flag – a classic chart pattern that often signals a continuation of the BTC downtrend.
The silver lining? A tight stop loss of only 0.86% with a potential take profit near 5%.”
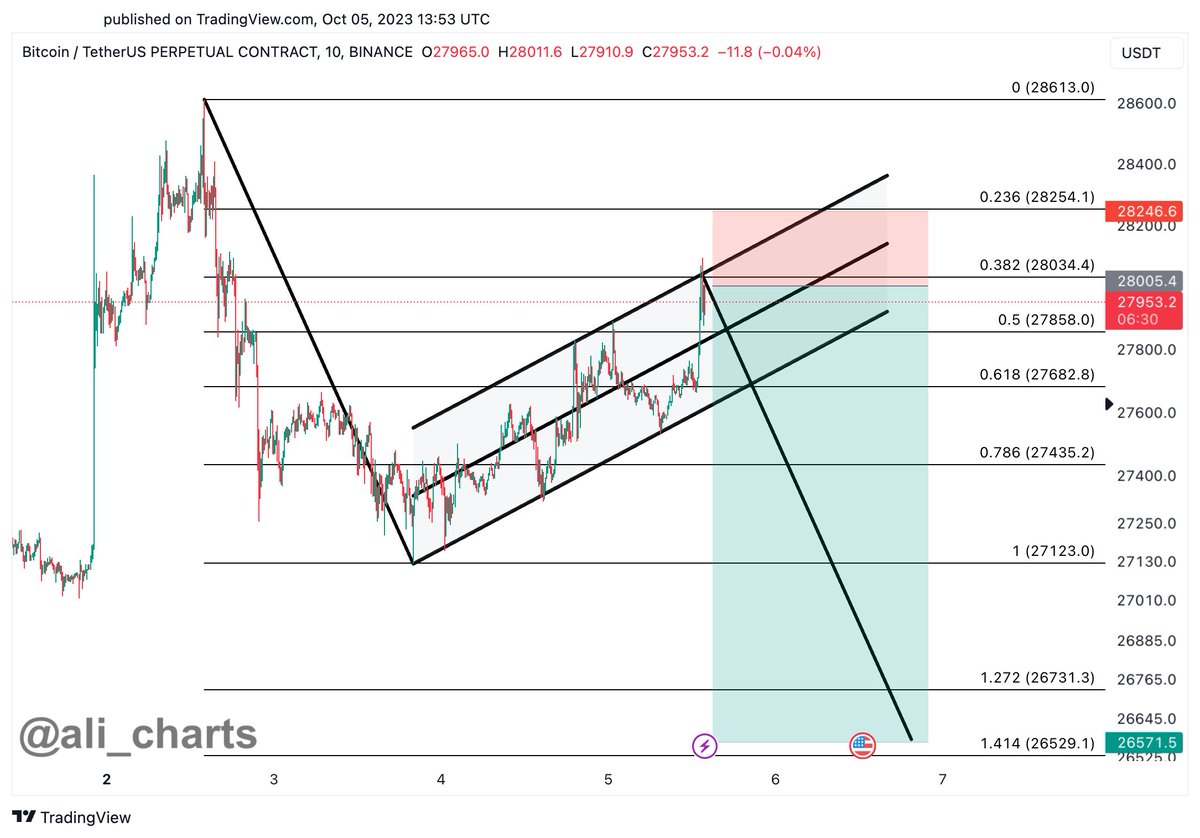
The trader’s chart indicates that the flag pattern will materialize if Bitcoin fails to flip support around the $28,034 level, causing it to dip down to $26,751.
The trader also says that a Bitcoin dip is further supported by the top crypto asset by market cap’s Relative Strength Index (RSI), a widely used momentum indicator that aims to determine if an asset is overbought or oversold.
“Notice that each time the RSI on BTC four-hour chart hits or surpasses 74.21, BTC tends to retrace. The RSI on the four-hour chart recently hit 82.83!”
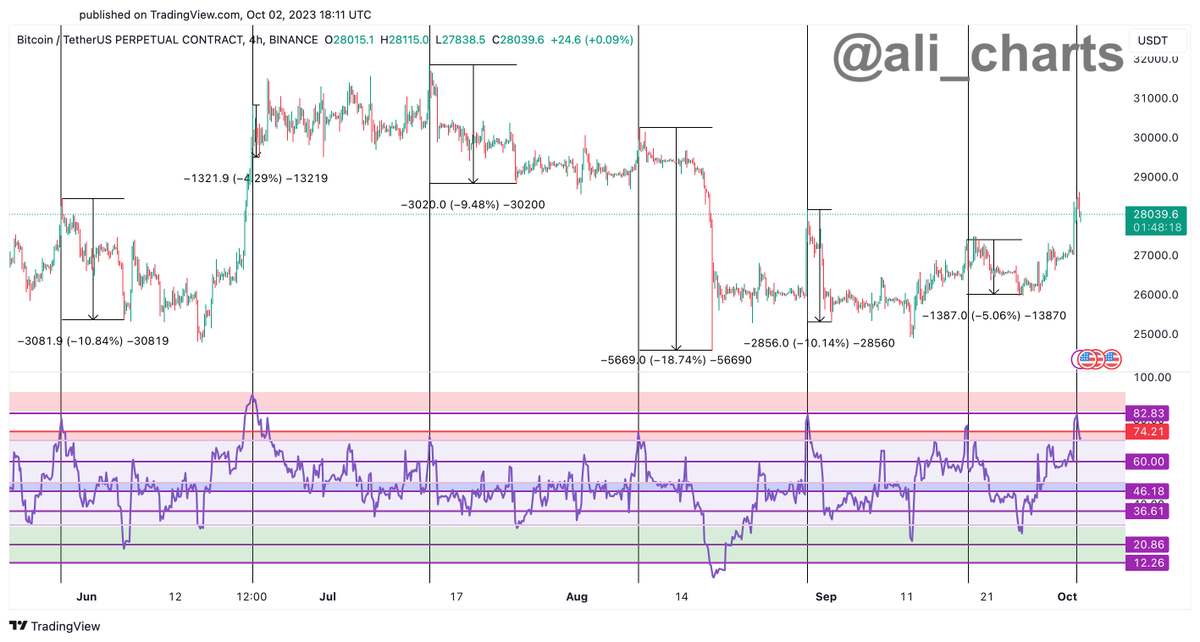
The RSI indicator scales from 0 to 100. A reading of below 30 is typically considered bullish while a reading of over 70 is typically considered to be a bearish sign.
Bitcoin is trading for $27,568 at time of writing, up 0.6% in the last 24 hours.
The trader also weighs in on Ethereum (ETH) and says that the second largest crypto asset by market cap is setting the stage for a bullish reversal based on the market value to realized value (MVRV) indicator.
“Ethereum market cycles transition from bearish to bullish when the MVRV (blue line) breaks strongly above the MVRV 180-day SMA (red line). Currently, ETH remains in a distribution phase, awaiting heavy accumulation!”
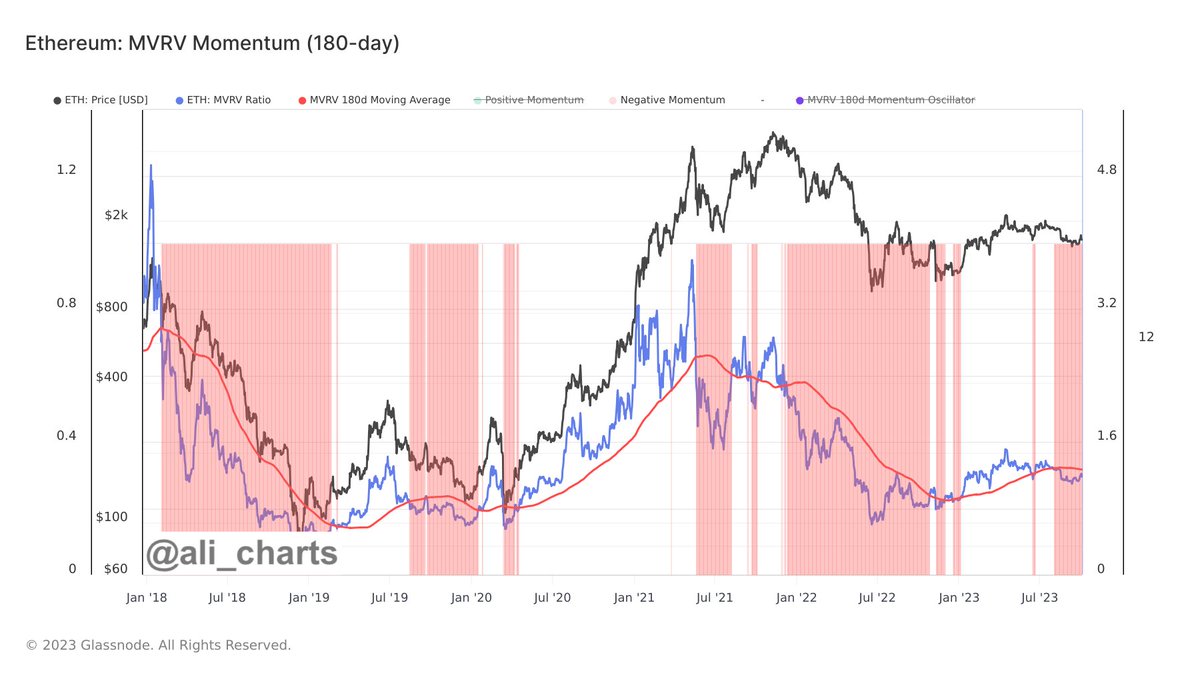
The MVRV compares an asset’s total market cap to its realized value and can be used to time market tops and bottoms.
ETH is trading for $1,618 at time of writing.
Don’t Miss a Beat – Subscribe to get email alerts delivered directly to your inbox
Check Price Action
Follow us on Twitter, Facebook and Telegram
Surf The Daily Hodl Mix
 

Disclaimer: Opinions expressed at The Daily Hodl are not investment advice. Investors should do their due diligence before making any high-risk investments in Bitcoin, cryptocurrency or digital assets. Please be advised that your transfers and trades are at your own risk, and any loses you may incur are your responsibility. The Daily Hodl does not recommend the buying or selling of any cryptocurrencies or digital assets, nor is The Daily Hodl an investment advisor. Please note that The Daily Hodl participates in affiliate marketing.
Featured Image: Shutterstock/NextMarsMedia


